GeoVisInfo – visual geographical information
The role of visual information in geography
|
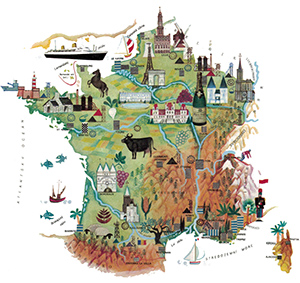
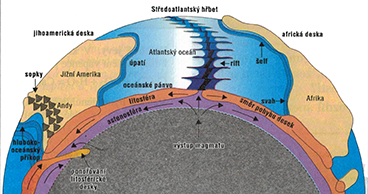
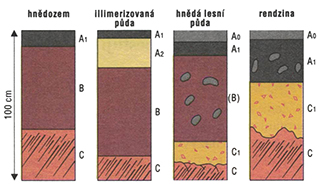
Various forms of visual information (e.g. mural paintings, smoke signals, primitive sketches and maps, etc.) have been a part of human communication since time immemorial (Kress & van Leeuwen, 1990; Ringshausen, 1976). However, using visual things for communicating and understanding uncommon and everyday matters also plays an important role in the present. The phenomenon which it referred to as a visual (or iconic) turnover (e.g. Benedek & Nyíri, 2012; LaSpina, 1998) or directly the coming of visual culture (Dikovitskaya, 2005) has contributed greatly to the current expansion of visual means of communication in various fields of human knowledge and behaviour. The dynamic development of the media (mass media) has thus brought a number of “new” environments (the Internet and mobile applications), tools (e.g. YouTube and Facebook) and techniques (e.g. digital photography) in the 20th and 21st century and these enable not only experts, but also the general public to create, distribute and evaluate visual information. But the massive increase in visual information also leads to questions about whether an individual is able to process this amount of information available and use it effectively. Or, on the contrary, whether an individual is overloaded with visual information or even manipulated by it. Geography and its educational school subject, geography, represent the fields for which visual information is irreplaceable. First of all we certainly recall maps and other cartographic products. The importance of visual information can be seen in the fact that they offer a more specific and realistic view of phenomena which would otherwise be difficult to grasp. And it is the subject matter of geography what is quite rich in just such phenomena which it is not possible to face immediately and where it may be difficult for pupils to imagine them without visual representation; whether it is its physical geography part (phenomena and processes related to the entire planet Earth, taking place in the atmosphere or under the surface of the Earth, for example), or its human geography part (causes and consequences of reproduction and migration of populations, economic development, presentations of different cultures, and others). The subject matter of geography should thus be accompanied by plenty of nonverbal elements (graphs and charts, schemes, drawings, photographs, etc.). As Mareš (1995) states, for example, despite all of this schools do not teach too much to analyse visual information critically. While pupils are taught systematically to understand verbal communication during the school teaching process, in the case of work with visual information it is relied on a certain automatic illustrative nature where it is not necessary to teach how to receive it. But the competence to receive, use and create visual information and products seems to be absolutely crucial to everyday life in our civilization. |
|
|
|
The concept of visual information and our research We understand visual geographic information to be a visual representation which enables to represent geographic phenomena and data with a various degree of abstractness (or generalization). It can occur both in the analogue form and in the digital form and influences perception, thinking and actions related to cultural, social, political and educational aspects of geographic phenomena. In the area of education, visual geographic information helps with transforming complex geographic phenomena into such form that is in accordance with different levels of experience and cognitive skills of pupils. Our research falls into a broader research field, which has a long tradition and is currently most often named Visual Research (Visual Studies). The research field covers a wide range of streams and themes. Research on visual aspects and their broad cultural context, formation and perception is done by a variety of branches and multidisciplinary approaches, named Visual Studies. These are dominated mainly by visual anthropology (Banks & Morphy, eds., 1997; Soukup 2010), media studies and cognitive psychology (Schnotz & Kulhavy, 1994) or also by the research interdisciplinary area which is usually named research on pictures (Levie, 1987, 1984; see also Anglin, Vaez & Cunningham, 2004). Concepts used in visual studies are increasingly frequently reflected in educational research (Finson, Pedersen, 2013), in the issues of the ability to read and communicate visual information, where the name Visual Literacy has become usual (Kalantzis & Cope, 2012). In the field of geography a large part of works dealing with visual information is connected with cartography and topics such as graphical semiotics, map language and map content (Bertin, 1967; Perkins, 2008, Bláha, 2010) and most recently with geographic information systems (Elwood, 2010); in geographic education we can find some works dedicated to an analysis of school cartographic tools and map skills of pupils (Bláha & Hudeček, 2010; Hanus & Marada, 2013). It can be stated that basic attention is paid to the evaluation of school geography textbooks from the viewpoint of work with visual information (Janko, 2012; Yasar & Seremet, 2007; Kučerová et al., 2014). The application of professional knowledge in the geography education practice is however very low or absent. Extensive interdisciplinary research was started in Czechia in the late 1950´s and an output of the research should be the Uniform System of School Cartographic Equipment for national history, geography and history teaching (Koláčný, 1964). Nevertheless, only a part of the project has been executed and this act has no parallel any longer in the Czech geographical education. |
References
| Anglin, G. J., Vaez, H., & Cunningham, K. L. (2004). Visual representations and learning: The role of static and animated graphic. In: D. H. Jonassen (Ed.), Handbook of research on education communications and technology (pp. 865–916). New Jersey, Mahwah: Lawrence Erlbaum Associates. Banks, M., & Morphy, H. (Eds.) (1997). Rethinking visual anthropology. London: Yale University Press. Benedek, A., & Nyíri, K (Eds.) (2012). The iconic turn in education. Frankfrut am Main: Peter Lang. Bertin, J. (1967). Sémiologie Graphique. Les diagrammes, les réseaux, les cartes. Paris: Gauthier-Villars. Bláha, J. D. (2010). Various ways of assessment of cartographic works. In: G. Gartner & F. Ortag (Eds.), Cartography in Central and Eastern Europe (pp. 211–229). Berlin: Springer Verlag. Bláha, J. D., & Hudeček, T. (2010). Hodnocení kartografických děl mentálními mapami. Kartografické listy, 18: 21–28. Dikovitskaya, M. (2005). Visual culture: The study of the visual after the cultural turn. Cambridge: MIT Press. Elwood, S. (2010). Geographic information science: Visualization, visual methods, and the geoweb. Progress in Human Geography, 35(3): 401–408. Finson, K. D., & Pedersen, J. E. (2013). Visual data and their use in science education. Charlotte: IAP Publishing. Hanus, M., & Marada, M. (2013). Mapové dovednosti v českých a zahraničních kurikulárních dokumentech: srovnávací studie. Geografie, 118(2): 158–178. Janko, T. (2012). Nonverbální prvky v učebnicích zeměpisu jako nástroj didaktické transformace. Brno: Masarykova univerzita. Kalantzis, M., & Cope, B. (2012). Literacies. Cambridge: University Press. Koláčný, A. (1964). Budování Jednotného systému školních kartografických pomůcek. Geodetický a kartografický obzor, 10/52(7): 165–169. Kress, G., & van Leeuwen, T. (1990). Reading images. Victoria: Deakin University. |
Kučerová, S. R., Novotná, K., Hátle, J., & Bláha, J. D. (2014). Geographical names frequency map as a tool for the assessment of territorial representations in geography textbooks. In: P. Knecht, E. Matthes, S. Schütze, & B. Aamotsbakken (Eds.), Methodologie und Methoden der Schulbuch und Lehrmittelforschung (pp. 264–275). Bad Heilbrunn: Klinkhardt. LaSpina, J. A. (1998). The visual turn and the transformation of the textbook. New York, London: Routledge. Levie, W. H. (1984). Research and theory on pictures and imaginal processes: A taxonomy and selected bibliography. Journal of Visual/Verbal Languaging, 4(2): 7–41. Levie, W. H. (1987). Research on pictures: A guide to the literature. In: D. M. Willows, & H. A. Houghton (Eds.), The psychology of illustration. Vol. 1. Basic research (pp. 1–27). New York, Berlin, Heidelberg: Springer Verlag. Mareš, J. (1995). Učení z obrazového materiálu. Pedagogika, 45(4): 318–327. Perkins, C. (2008). Cultures of map use. The Cartographic Journal, 45(2): 150–158. Ringshausen, G. (1976). Von der Buchillustration zum Unterichtsmedium. Weinhem: Beltz Verlag. Schnotz, W., & Kulhavy, R. W. (1994). Comprehension on graphics. Advances in Psychology No. 108. Amsterdam: North-Holland. Soukup, M. (2010). Vizuální antropologie: vznik, vývoj a milníky. In: D. Čeněk & T. Porybná (Eds.), Vizuální antropologie: kultura žitá a viděná (s. 15–23). Červený Kostelec: Pavel Mervart. Yasar, O., & Seremet, M. (2007). A comparative analysis regarding pictures included in secondary school geography textbooks taught in Turkey. International Research in Geographical & Environmental Education, 16(2): 157–188. |


